 Initializing download.
-
 By Gabrielle Hallai
Cleveland Clinic - Uploaded on May 13, 2024.
- Last modified by Joshua Friedman on May 14, 2024.
- Rating
- Appears in
- Miscellaneous
- Condition/keywords
- visual evoked potential, VEP, pattern VEP, flash VEP
- Photographer
- Gabrielle Hallai, PhD, Cleveland Clinic Cole Eye Institute
- Description
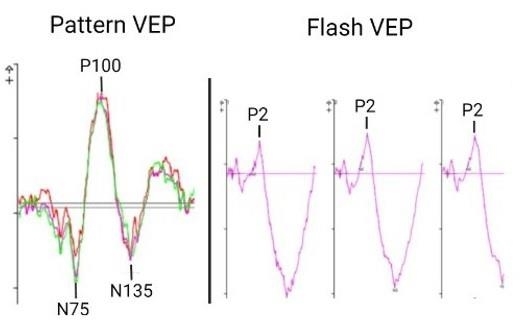
- The left most figure demonstrates a normal pattern VEP response. The waveform is composed of a negative N75 peak, a positive P100 peak, and another negative N135 peak. The timing and amplitude of this response can be compared to determine if optic nerve/post-retinal visual pathways are functioning normally or abnormally. The second figure contains examples of a normal flash VEP response. In this case, a three channel VEP was completed which can help to determine chiasmal abnormalities. The major consistent component to assess in the flash VEP is the positive P2 peak that occurs around 120 ms. Pattern VEP responses were recorded using the Diagnosys pattern VEP protocol on a CRT monitor. Flash VEP responses were recorded using the Diagnosys ColorDome stimulator.


